Figure 5
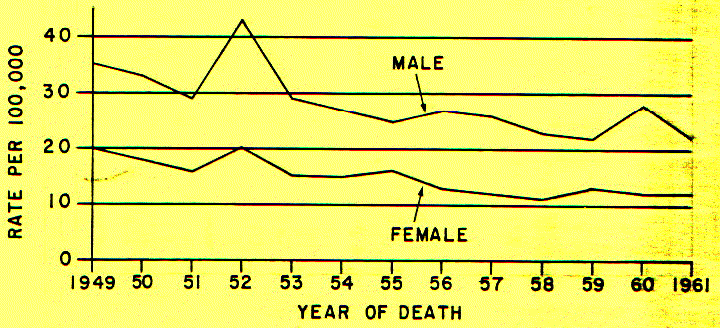
Age-adjusted death rates per 100,000 population for cancer of the stomach, males and females, Connecticut 1949-I961.
The above epigram is related to the fact that statistics are often used to "sell things." People use statistics to document almost everything, with the same statistics sometimes being used to document opposing points of view. The number of examples of perversion of statistics, to serve almost any purpose, are legion. The statistician who deals with cancer is in a very different position. His gain is dependent on his being completely and totally honest. The result is that cancer statistics are fundamentally reliable, and any problems which might cause one to question their reliability are based, not upon the statistical methods, but on some of the difficulties encountered in obtaining accurate information.
When a scientist does an experiment with 1,000 mice, he knows that they are in their cages and, if he is a good observer, he can tell what's happening to them. He knows the age of the mice when the experiment started, and when an animal dies he can record it with reasonable accuracy. This is not true with people. They move from one area to another and no one, at the present time, keeps close track of them except the Internal Revenue Service.
The State of Connecticut keeps very good records of the numbers of people with cancer, and the reliability of their diagnosis is extremely high. How accurate are the estimates of the total population in each age group? When Jack Benny says he's thirty-nine, can you believe it?
Using modern computers, it should be possible to keep track of every human being in the country from the time he is born. This would require that every time someone moved, married, or changed his name, this would have to be registered with the government. With Social Security numbers, this may be a real possibility at the present time. There is an understandable reluctance of the American public to submit to things that are generally associated with totalitarian governments. There is a basic conflict between the need for accurate information about the movements, activities, and diseases of people, with what Americans consider to be their God-given right to get lost. If Social Security numbers were assigned at birth, and the various branches of the government, such as the Internal Revenue Service and the National Institutes of Health, talked to one another (a remote possibility), it might be possible to obtain some fairly reliable statistics about the makeup of the population of this country. As a scientist, I can see the desirability of knowing about population movements, and getting complete information about cancer statistics; but as a human being, I think that I might prefer to retain the privilege of getting lost if I wanted to, The thought of having to report my movements (which I do anyway in order to drive a car and earn money) is anathema. I wonder, though, whether it is worth retaining what little is left of the illusion that I am a free individual in a free country at the expense of not knowing whether we are doing any good with regard to preventing or treating cancer.
To say that there are more cases or fewer cases of cancer tells us very little about what is really happening to a population of people. We may be having more cases of cancer simply because people are living longer; cancer being largely a disease of old age. We can get some information about what is really happening by looking at what the actuaries (these are the people who predict the chances of your dying tomorrow) call the "age specific death rate." This tells you what percentage of a population at any particular age is dying of a particular disease --in our case, cancer.

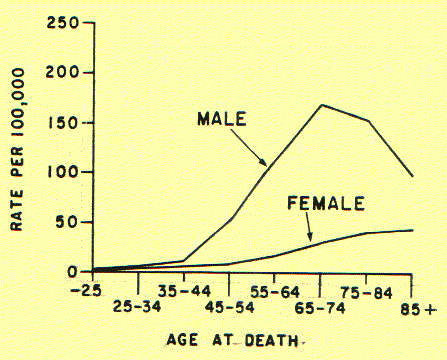
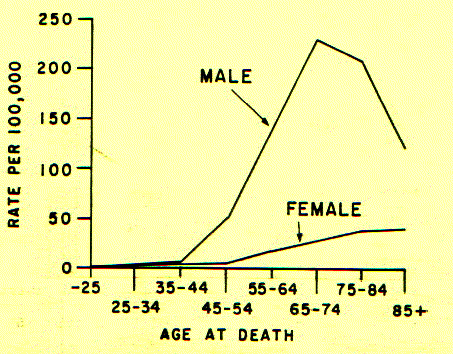
Figure 3 gives the average age specific death rates per 100,000 population for cancer of the lung, bronchus, and trachea in Connecticut from 1949 to 1955, while Figure 4 does the same thing for 1956 to 1961; these are the cigarette-smoking associated cancers. If we look at Figure 3 and the line for males, you can see that this particular type of cancer starts appearing after 30 and the rate goes up progressively so that the peak incidence is between 65 and 74. If we were dealing only with a smoking population, the incidence would continue to climb. The reason for the drop is probably that there are a number of people who live past 74 who do not smoke and are left over; while the smokers are dying early. Now, if we want to know whether the rate of occurrence of lung cancer is going up, we compare the 55 to 64 age group in Figure 3 with the same age group in Figure 4 and find that the incidence has gone up from about 115 to 150 when we compare the five-year period starting in I949 and the one starting in I956 in this age group.

Average age specific death rates per 100,000 population for cancer of the lung, bronchus, and trachea, males and females, Connecticut 1956-1961.
This is not too convincing by itself, but when we compare the 65 to 74 age group, we find that this groups' cancers have also gone up from about I70 to about 225 in the same five year period, This is very convincing, and clearly indicates that lung cancer in males has gone up considerably. Not much has happened as far as the females are concerned. This is probably a cultural difference, and the liberated woman who smokes is likely to develop as much lung cancer as men before too long.
Another way of looking at what is happening with regard to cancer is a figure called "the age-adjusted cancer rate," which adjusts the occurrence of cancer for the entire population and enables us to compare cancer rates in a total population from year to year. How good these estimates are is a matter of the ability of the actuary to obtain an accurate estimate of the whole population and their ages. The age-adjusted death rate is used to create charts which show whether a particular type of cancer is actually increasing or decreasing. A good example of this is Figure 5 which shows the age-adjusted death rate for cancer of the stomach.

Figure 5
Age-adjusted death rates per 100,000 population for cancer of the stomach, males and females, Connecticut 1949-I961.
If you look at Figure 5, you can see that the rate is continually going down (with the exception of 1952 where it peaked at about 42 cases per 100,000). This way of observing trends is a very useful way of viewing cancer statistics. As you see, the incidence of cancer of the stomach is going down, It is now almost half of what it was in 1949. I might add that the group of cancers collectively referred to as leukemia continue to go up until 1961. After 1961, it appeared to start going down. This has been attributed to the more prudent use of medical x-ray, This turndown in rate started after 1943 in children under one year, and in 1958, for people fourteen years or over. The information being collected in the next ten years should help clarify what is really happening.
You can, if you wish, read the age-adjusted incidence rates in much the same way as you would read a stock market report. For example, we can say that most cancers have remained unchanged. The averages (cancer at all sites) rose by about one third from 1935 to 1960. For the same period of time, stomach cancer declined to about half of its 1935 level. In response to early diagnosis and the wide application of the Pap test, mortality due to cancer of the uterus has also declined to about half of its I935 level. Cancer of the large intestine and pancreas showed a slight gain; cancer of the rectum and esophagus about the same. In response to increased tobacco sales, cancer of the respiratory system, particularly of the bronchus and lung, rose to about five times the 1935 levels in men, and showed a slight gain in women. Leukemia and related blood cell tumors about doubled since 1935. The penny stocks (low incidence) such as cancer of the prostate, urinary system, brain, central nervous system, and thyroid, all rose to about double their 1935 levels. Cancer of the genital organs and breasts, after showing a dip between 1940 and 1945, came up and slightly surpassed the 1935 levels. We can interpret this as indicating that the cancer market is clearly bullish.
If you are interested in cancer statistics, the American Cancer Society publishes a pamphlet annually called "Cancer Facts and Figures." It is available for the asking.
Statistics on human cancer can provide us with clues about what is causing cancer and with the kinds of information that we need to enable us to determine whether the treatments that are being used are really effective. Human cancer statistics provided both the clues and the final evidence that showed that cigarette smoking caused lung cancer. It could not be determined any other way since, until very recently, no one was able to find a way to persuade a mouse to inhale a cigarette in the same way that human beings do. Attempts to produce cancer in mice with clouds of cigarette smoke failed. The statistical information on human lung cancer incidence correlated with tobacco smoking was sufficient to prove conclusively that cigarette smoking was the major factor in the increased incidence of lung cancer. The final bits of evidence were obtained by taking cigarette smoke condensates and painting them on the skin of mice and producing skin cancer rather than lung cancer, which showed that the chemicals in cigarette smoke could produce cancer. Someone has recently devised a way of piping cigarette smoke into the windpipe of dogs and is able to produce some of the changes that we see in people.
Scientists who obtain and use cancer statistics prefer to call themselves epidemiologists. It is reasonable to suspect that at least some of the clues about what is causing cancer will come from the work of these people. There have been a number of agents causing cancer in man that were discovered by this means. One of these is the chemical that causes cancer of the bladder in workers in the chemical industry. It was cancer statistics that showed that radiation produced leukemia in people.
We periodically read about "cancer houses" and the fact that an occasional cluster of the same kind of cancer may appear in a single location. We read in the newspapers about a group of young people, who go to a particular high school, all coming down with a relatively rare type of tumor. Is it cause and effect, or coincidence?
Finding a cluster of cases is an interesting clue, and it is possible that one of these clusters may yield some useful information; but, by itself, finding a cluster of cases is of little value, and is really not worth publishing in the newspapers. The man who throws dice and wins twenty times in a row is doing something that is highly improbable (about one chance in a million); but this is no reason to assume that the dice are loaded. It might be a good idea to take a look at them, but you certainly can't accuse him of cheating. Improbable events happen all the time. The occurrence of improbable events is the basis for most accidents. The fact that four cars enter the same intersection at the same time is highly improbable, but once the crash has occurred, it becomes a certainty. The fact that once an event has occurred its probability is 100% is something that even escapes some statisticians. Most people are aware that a probability of 100% means certainty, now that the weather forecasts are being given in percentiles. When you hear the man on the radio say that the probability of precipitation is 20%, and you look out the window to see the rain pouring down, it should provoke at least a chuckle. We all know that when it's raining, the probability of it happening is 100%, and it makes little difference what the probability was before the rain started pouring down.